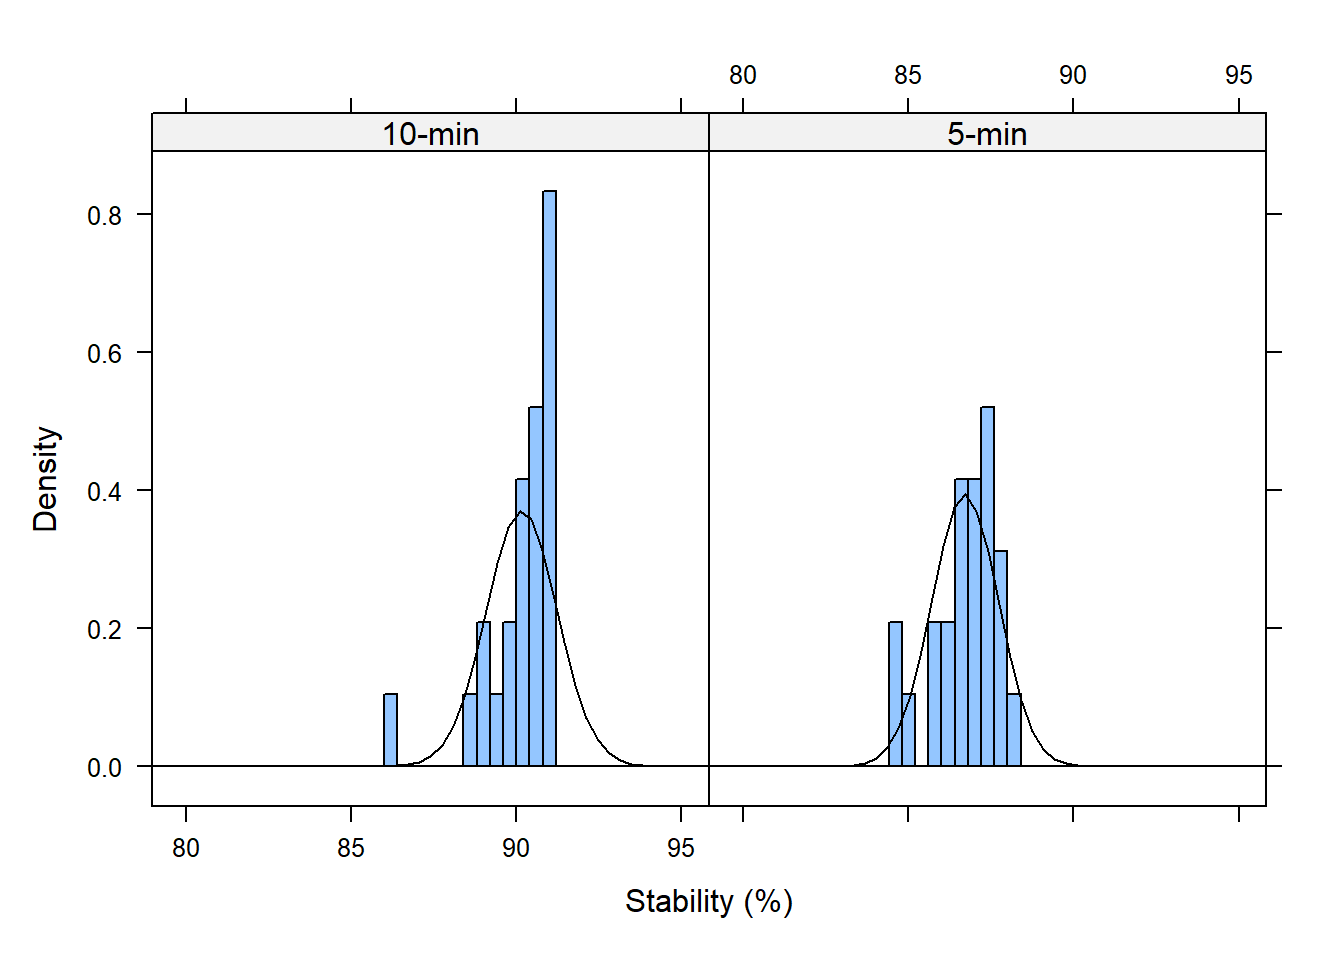
library(lattice)histogram( ~ stability | time, data = my_data,xlab ="Stability (%)", type ="density",breaks =seq(from =80, to =95, by =0.4),panel =function(x, ...) {panel.histogram(x, ...)panel.mathdensity(dmath = dnorm, col ="black",args =list(mean=mean(x),sd=sd(x))) } )
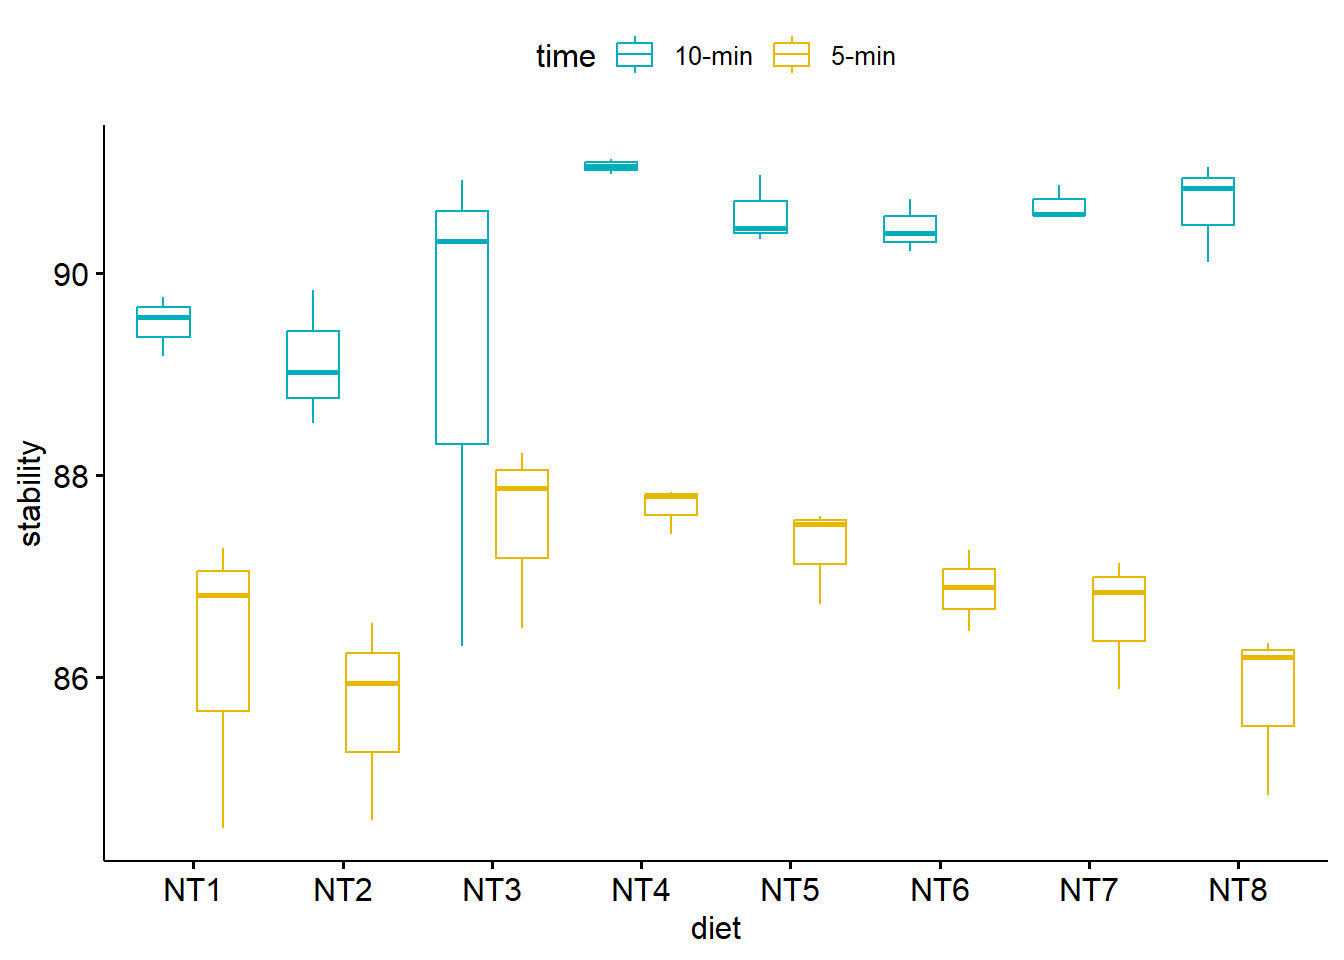
Box plot with multiple groups
library(ggpubr)ggboxplot(my_data, x ="diet", y ="stability", color ="time",palette =c("#00AFBB", "#E7B800"))
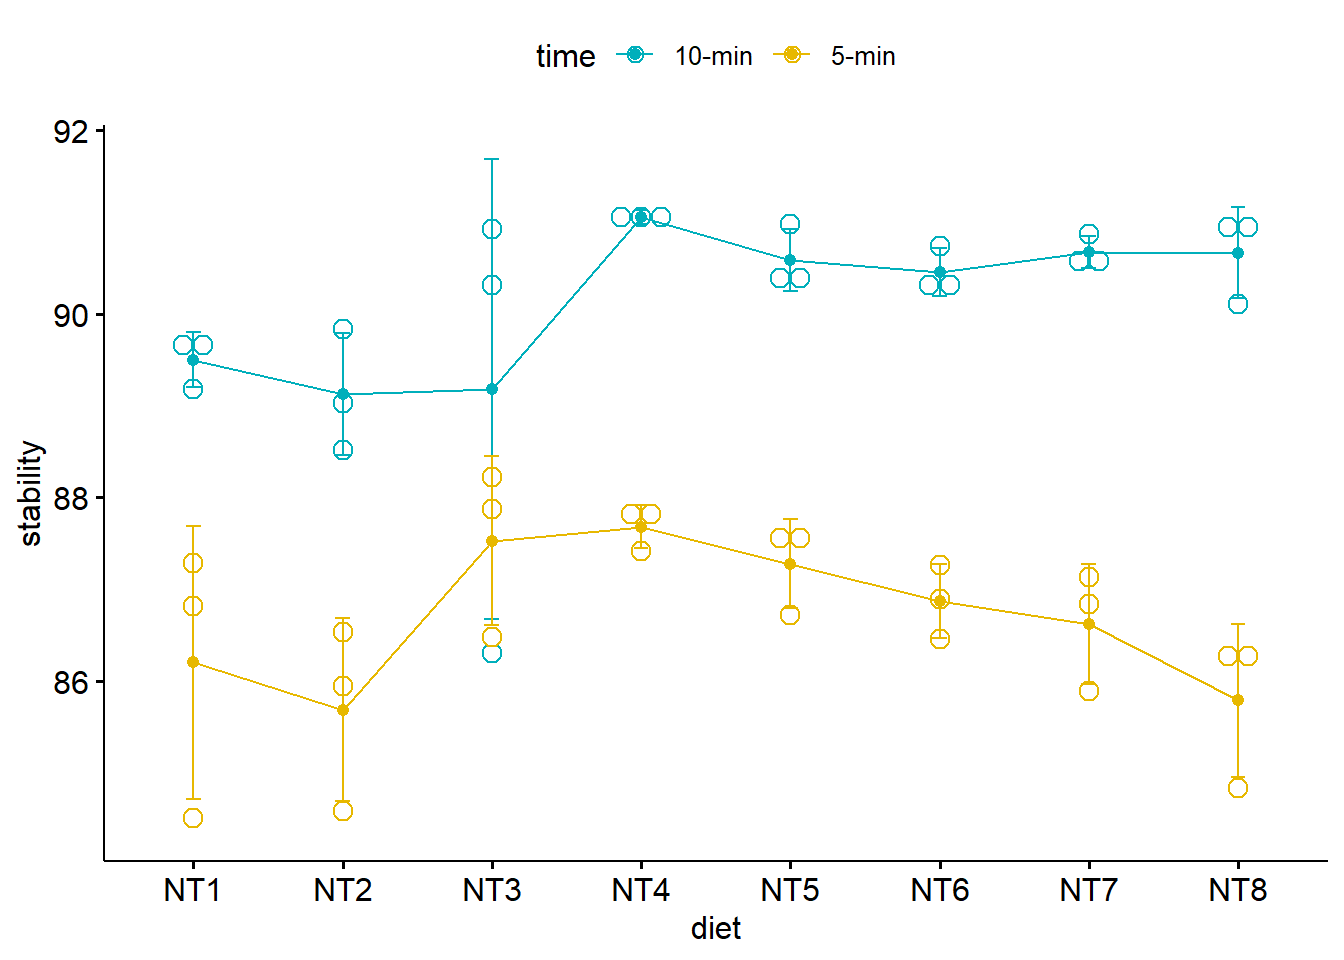
Line plots with multiple groups
# Add error bars: mean_se# (other values include: mean_sd, mean_ci, median_iqr, ....)library("ggpubr")ggline(my_data, x ="diet", y ="stability", color ="time",add =c("mean_sd", "dotplot"),palette =c("#00AFBB", "#E7B800"))
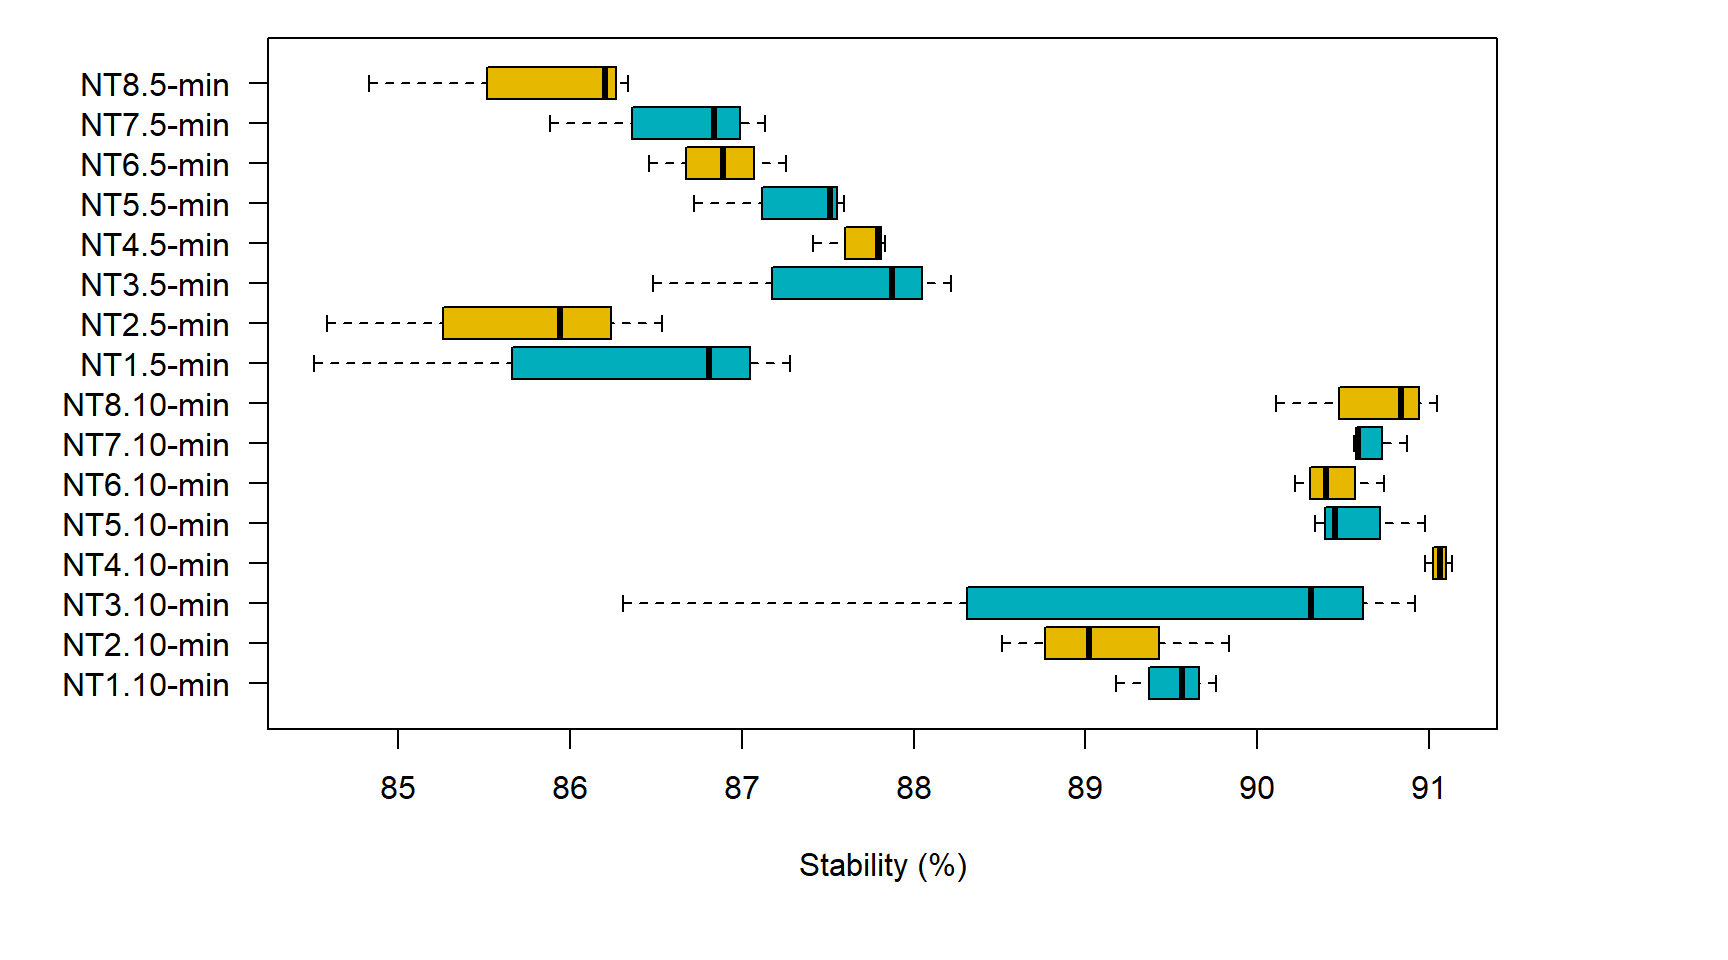
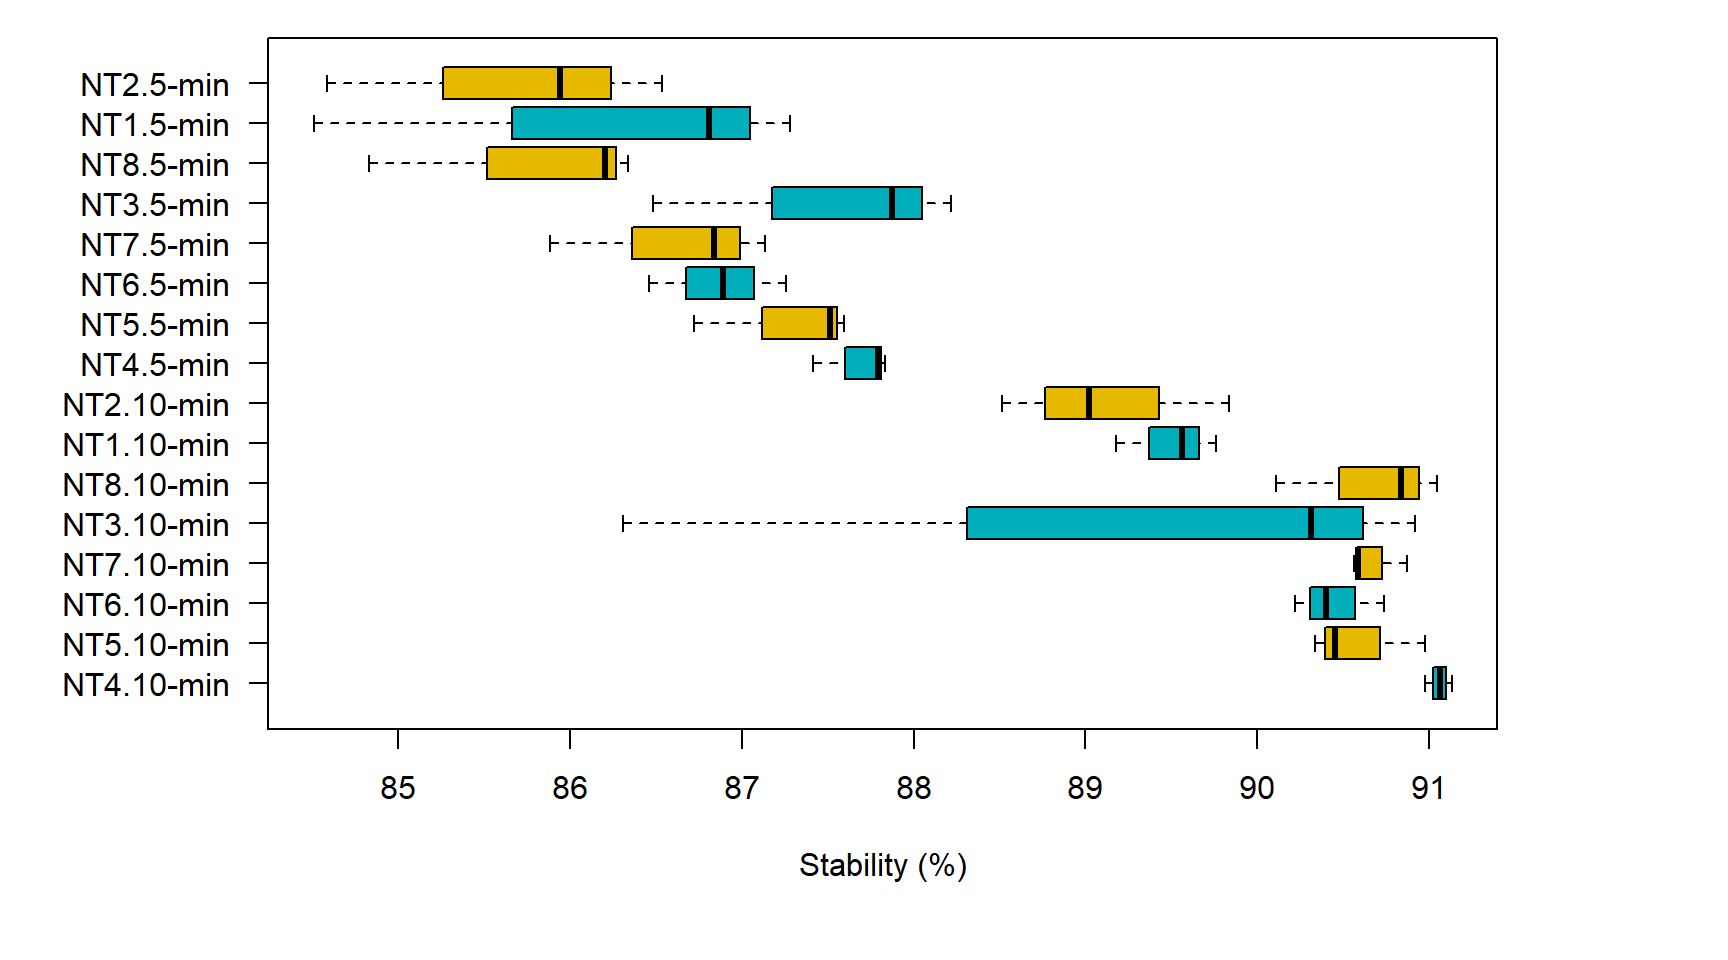
Box plot with two factor variables
oldpar <-par(no.readonly =TRUE)par(mar =c(6, 7, 1, 6))boxplot(stability ~ diet * time, data = my_data, frame =TRUE, col =c("#00AFBB", "#E7B800"), horizontal =TRUE, las =1,axisnames =TRUE, ylab ="", xlab ="Stability (%)")
par(oldpar)
Nếu muốn vẽ boxplot theo thứ tự các cột thì cần reorder cột factor diet theo stability
my_data$diet <-reorder(my_data$diet, my_data$stability, decreasing =TRUE) my_data$time <-reorder(my_data$time, my_data$stability, decreasing =TRUE) oldpar <-par(no.readonly =TRUE)par(mar =c(6, 7, 1, 6))boxplot(stability ~ diet * time, data = my_data, frame =TRUE, col =c("#00AFBB", "#E7B800"), horizontal =TRUE, las =1,axisnames =TRUE, ylab ="", xlab ="Stability (%)")
par(oldpar)
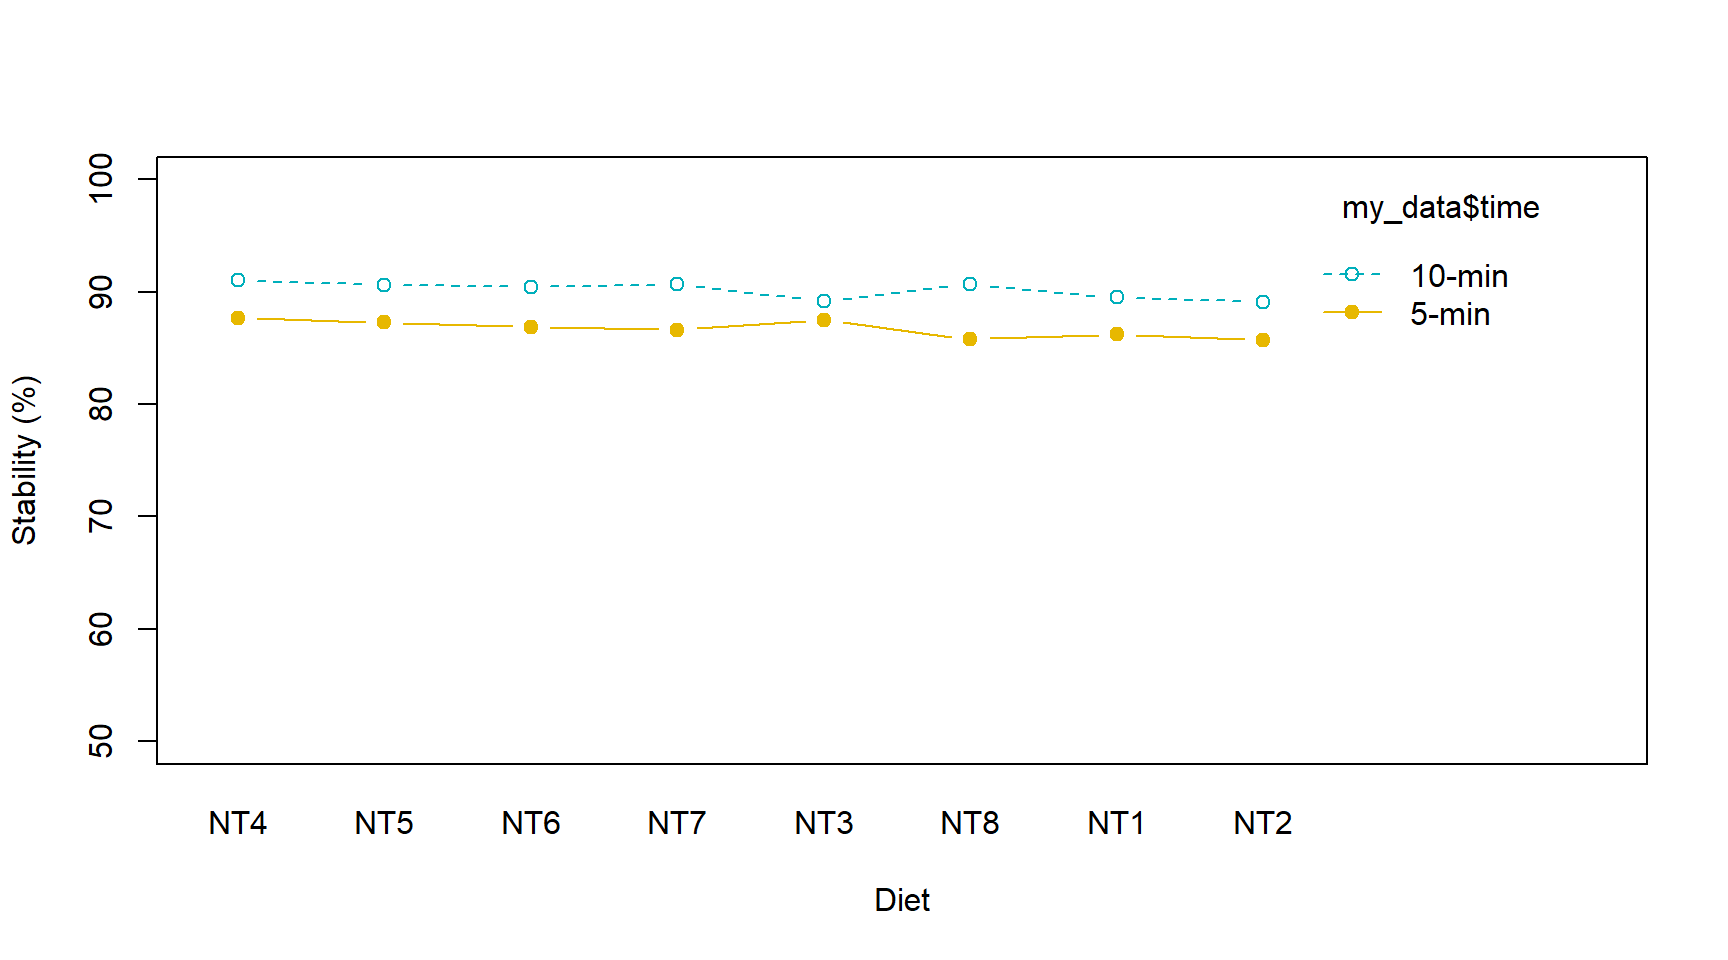
Two-way interaction plot
interaction.plot(x.factor = my_data$diet, trace.factor = my_data$time, response = my_data$stability, fun = mean, type ="b", legend =TRUE, xlab ="Diet", ylab ="Stability (%)",pch =c(1, 19), col =c("#00AFBB", "#E7B800"),ylim =c(50, 100))